Table of Contents
ASCII_Analysis.ipynb
This Jupyter notebook, titled 'ASCII_Analysis.ipynb', is a comprehensive analysis tool designed for the exploration and statistical study of ASCII data related to dance movements and the associated emotional states. The script includes functionalities for data preprocessing, visualization, and the extraction of meaningful statistics from time-series data. Through various statistical and signal processing techniques such as Lomb-Scargle periodograms and Gaussian fitting, it investigates properties like the center of position evolution, average distance from center, velocity analysis, and frequency domain analysis to discern patterns correlated with different emotions in dance movements. The notebook utilizes libraries such as pandas, matplotlib, numpy, scipy, seaborn, and mplEasyAnimate for its analysis.
- snippet.python
import pandas as pd
import matplotlib.pyplot as plt
from mpl_toolkits.mplot3d import Axes3D
from tqdm import tqdm
import numpy as np
from mplEasyAnimate import animation
from scipy.signal import lombscargle
import os
from scipy.optimize import curve_fit
import seaborn as sns
- snippet.python
def frameToArray(frame):
    start = 1
    vecs = np.zeros(shape=(int((frame.shape[0]-1)/3), 3))
    for itr, end in enumerate(range(4, frame.shape[0]+3, 3)):
        vecs[itr] = np.array(frame[start:end])
        start = end
    return vecs
- snippet.python
def CalcCenterOfPos(frame):
    vecs = frameToArray(frame)
    return vecs.mean(axis=0)
- snippet.python
def CenterOfPosEvolution(df):
    COPs = np.zeros(shape=(df.shape[0], 3))
    times = df['Time'].values
    for itr, frame in tqdm(df.iterrows(), total=df.shape[0]):
        COPs[itr] = CalcCenterOfPos(frame)
    return COPs, times
- snippet.python
def getAvgPosFromCenter(frame):
    COP = CalcCenterOfPos(frame)
    vecs = frameToArray(frame)
    return np.abs(vecs-COP).mean(axis=0)
- snippet.python
def getAvgDistFromCenter(frame):
    COP = CalcCenterOfPos(frame)
    vecs = frameToArray(frame)
    return np.mean(np.sqrt(np.sum(np.power(np.subtract(COP, vecs), 2), axis=1)))
- snippet.python
def evolveAvgPosFromCenter(df):
    SEPs = np.zeros(shape=(df.shape[0], 3))
    times = df['Time'].values
    for itr, frame in tqdm(df.iterrows(), total=df.shape[0]):
        SEPs[itr] = getAvgPosFromCenter(frame)
    return SEPs, times
- snippet.python
def evolveAvgDistFromCenter(df):
    SEPs = np.zeros(shape=(df.shape[0],))
    times = df['Time'].values
    for itr, frame in tqdm(df.iterrows(), total=df.shape[0]):
        SEPs[itr] = getAvgDistFromCenter(frame)
    return SEPs, times
- snippet.python
def genLSP(t, y, s=None):
    nyquist = 1/(2*(t[1]-t[0]))
    res = (t[1]-t[0])/t.shape[0]
    if not s:
        s = int(1/res)
    f = 2*np.pi*np.linspace(res/10, 0.5, s)
    pgram = lombscargle(t, y, f, normalize=True)
    return f, pgram
- snippet.python
analyzedFiles = os.listdir('AnalyzedData/')
analyzedFiles = ["AnalyzedData/{}".format(x) for x in analyzedFiles if x[0] != '.']
- snippet.python
emotions = [(x.split('.')[0]).split('_')[-1] for x in analyzedFiles]
- snippet.python
data = list()
for file in analyzedFiles:
    analysis = np.load(file)
    data.append(analysis)
- snippet.python
for i, element in enumerate(data):
    data[i][1] = (data[i][1]-np.mean(data[i][1]))/np.mean(data[i][1])
- snippet.python
velocities = list()
for dance in data:
    vel = (np.roll(dance[1], -1) - np.roll(dance[1], 1)) / (np.roll(dance[0], -1) - np.roll(dance[0], 1))
    velocities.append(np.vstack([dance[0], vel]))
- snippet.python
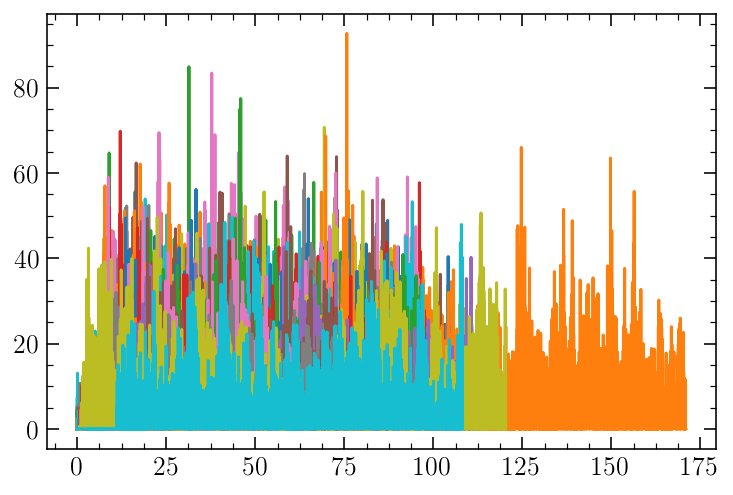
for dance in velocities:
    plt.plot(dance[0], abs(dance[1]))
- snippet.python
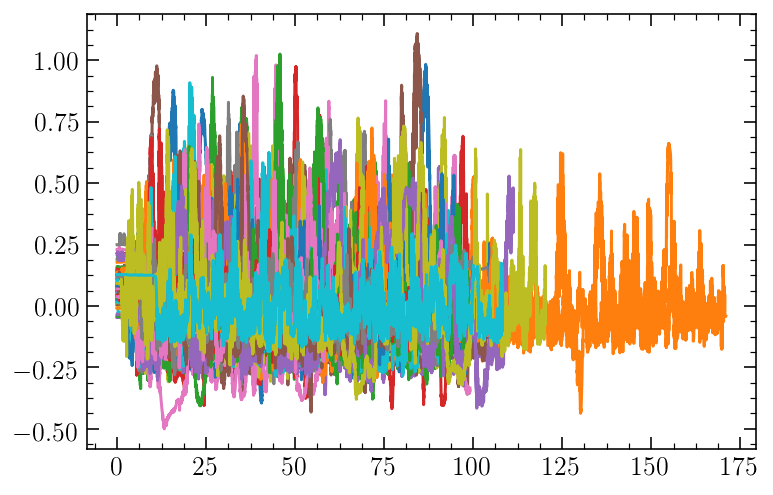
for dance in data:
    plt.plot(dance[0], dance[1])
- snippet.python
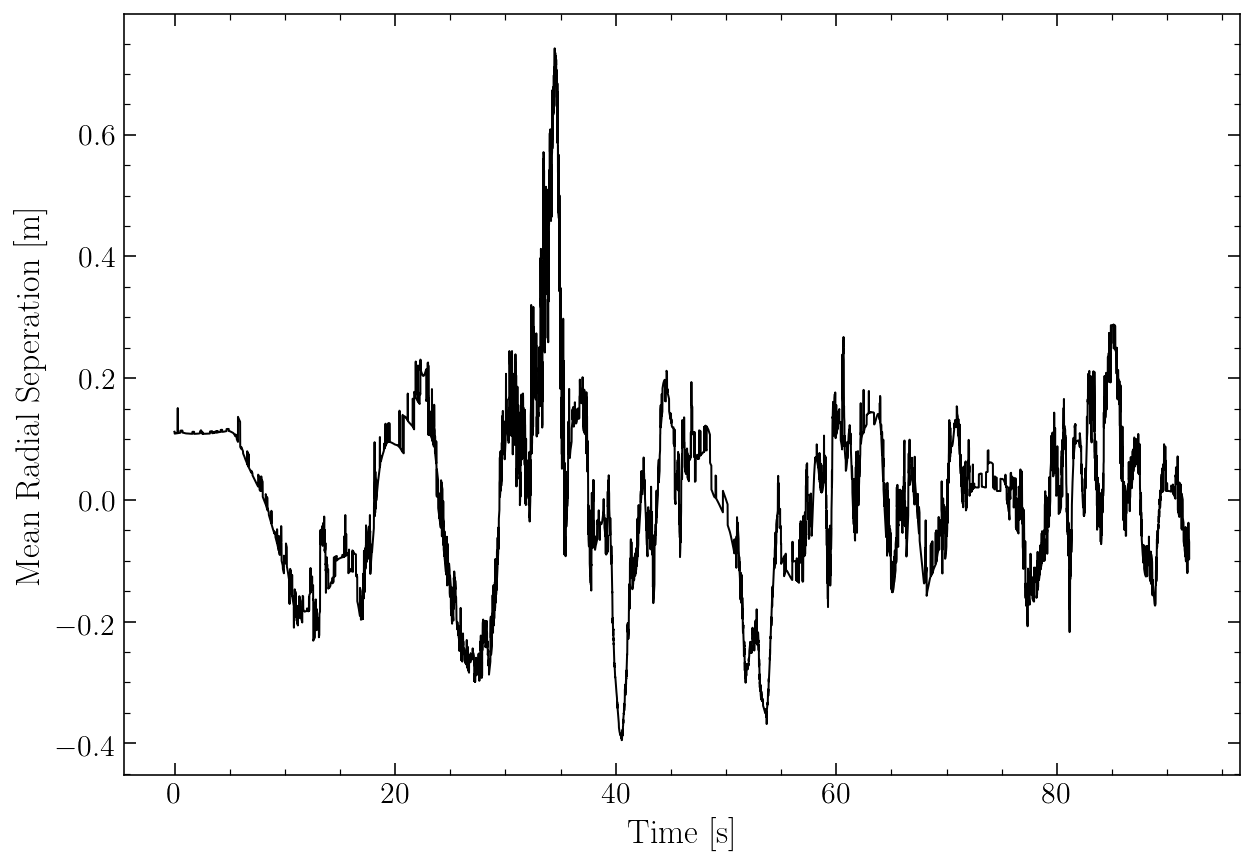
fig, ax = plt.subplots(1, 1, figsize=(10, 7))
ax.plot(data[0][0], data[0][1], 'k', linewidth=1)
ax.set_xlabel('Time [s]', fontsize=17)
ax.set_ylabel('Mean Radial Seperation [m]', fontsize=17)
ax.tick_params(axis='both', which='major', labelsize=15)
plt.savefig("Figures/MeanRadialSeperation.pdf", bbox_inches='tight')
Frequency Position Analysis
- snippet.python
FTs = np.zeros(shape=(49, 2, 2000))
- snippet.python
count = 0
for did, dance in tqdm(enumerate(data), total=len(data)):
    if did != 9:
        f, pgram = genLSP(dance[0], dance[1], s=2000)
        FTs[count, 0] = f
        FTs[count, 1] = pgram
        count += 1
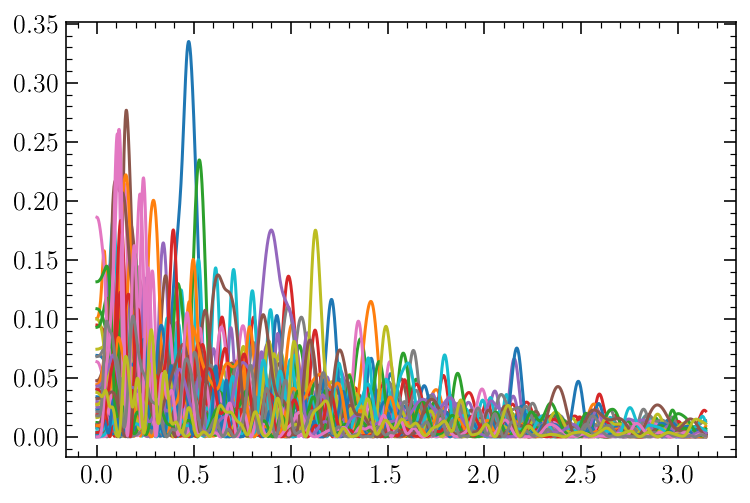
- snippet.python
for fid, FT in enumerate(FTs):
    if np.mean(FT[1]) > 0.4:
        print(fid)
    plt.plot(FT[0], FT[1])
- snippet.python
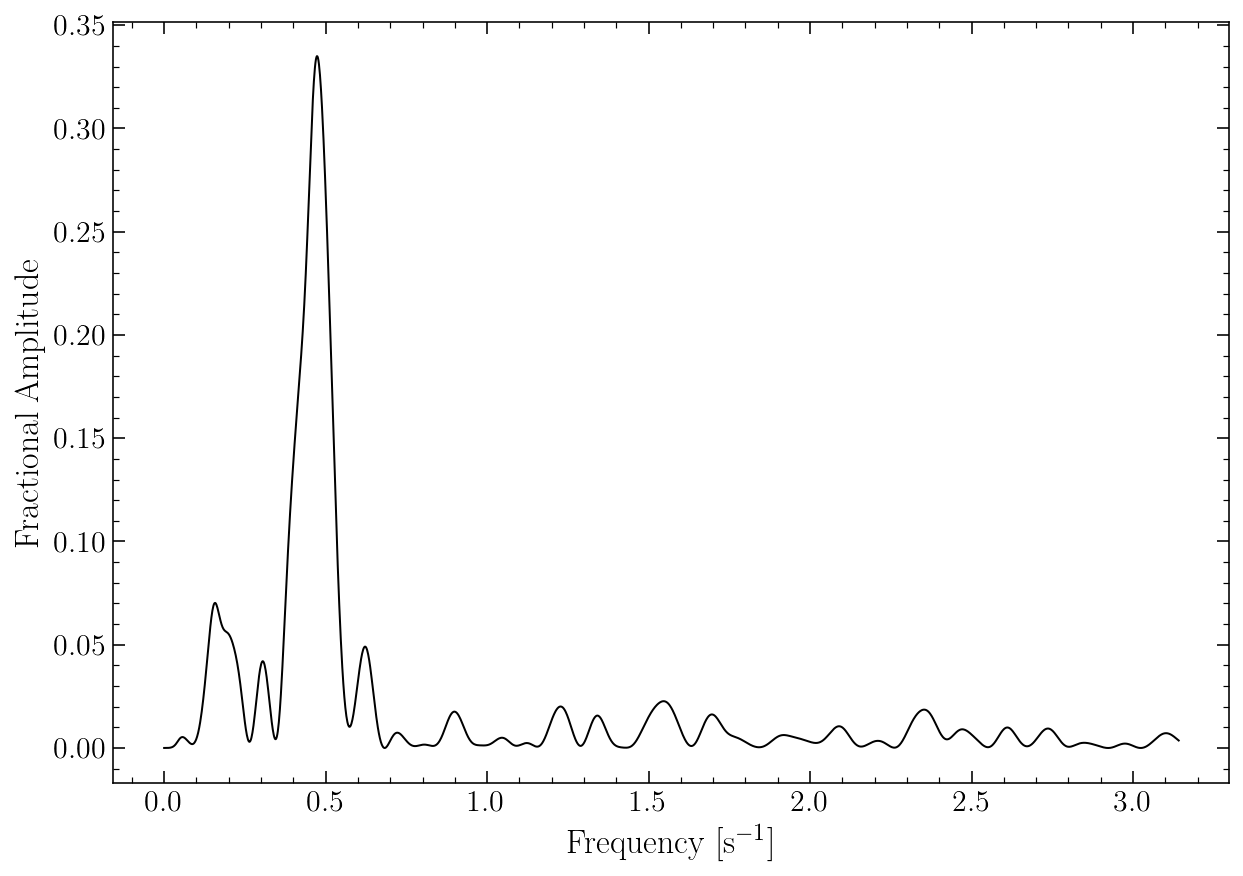
fig, ax = plt.subplots(1, 1, figsize=(10, 7))
ax.plot(FTs[0][0], FTs[0][1], 'k', linewidth=1)
ax.set_xlabel(r'Frequency [s$^{-1}$]', fontsize=17)
ax.set_ylabel('Fractional Amplitude', fontsize=17)
ax.tick_params(axis='both', which='major', labelsize=15)
plt.savefig("Figures/FTExample.pdf", bbox_inches='tight')
- snippet.python
len(evalEmotions)
49
- snippet.python
stats = np.zeros(shape=(49, 3))
evalEmotions = list()
count = 0
for fid, FT in enumerate(FTs):
    stats[count] = np.array([FT[0][FT[1].argmax()], FT[1][FT[1].argmax()], np.mean(FT[1])])
    evalEmotions.append(emotions[count])
    count += 1
- snippet.python
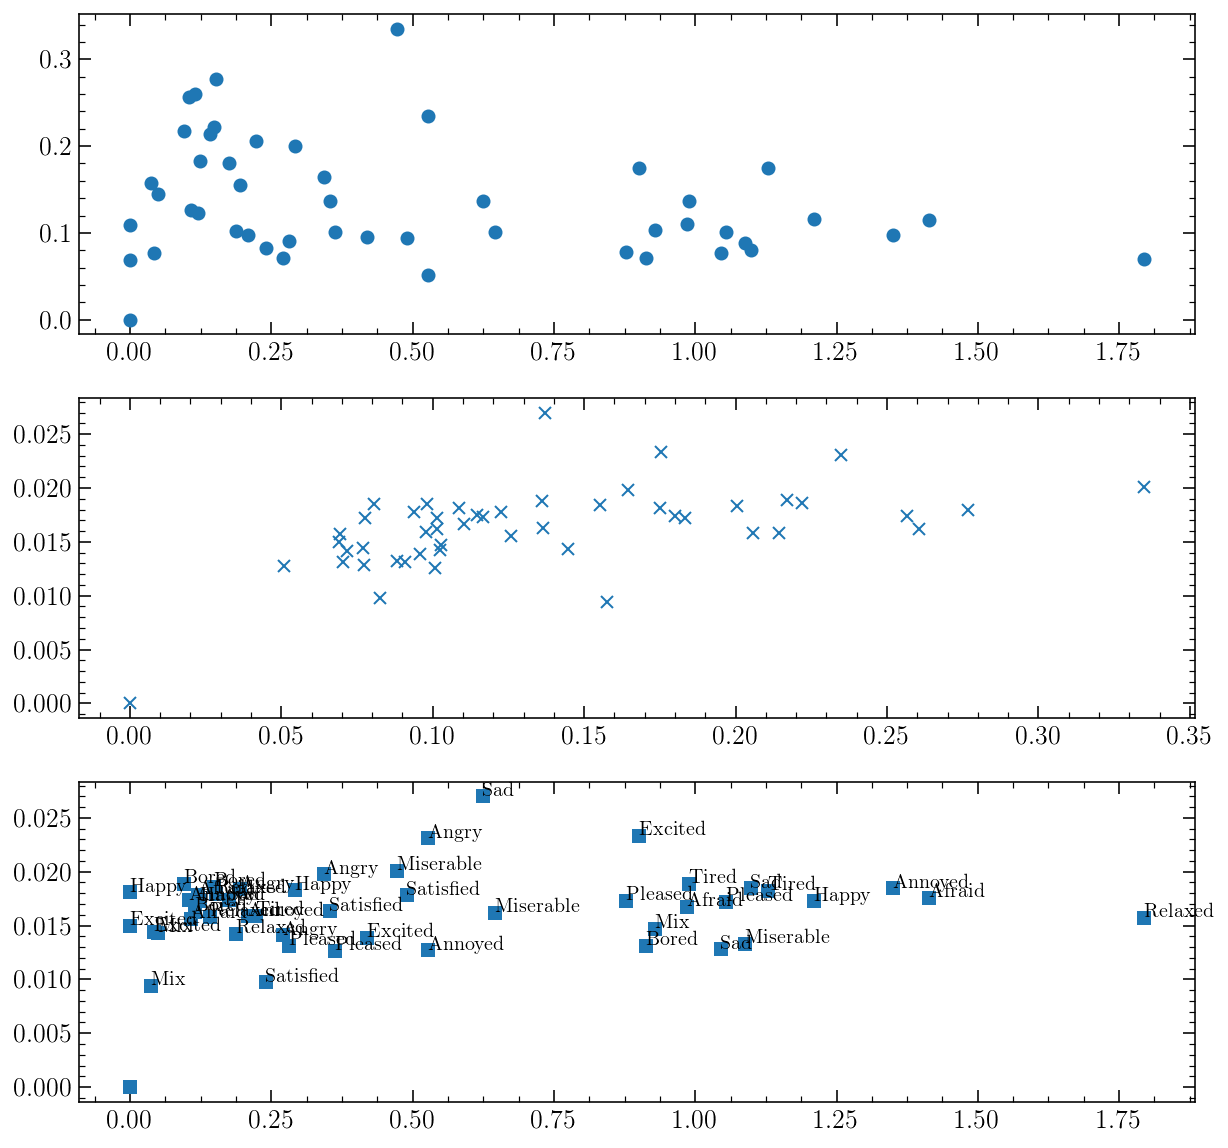
fig, axs = plt.subplots(3, 1, figsize=(10, 10))
axs[0].plot(stats[:, 0], stats[:, 1], 'o')
axs[1].plot(stats[:, 1], stats[:, 2], 'x')
axs[2].plot(stats[:, 0], stats[:, 2], 's')

for stat, emotion in zip(stats, evalEmotions):
    axs[2].annotate(emotion, xy=(stat[0], stat[2]))
- snippet.python
gaus = lambda x, mu, sigma: 1/np.sqrt(2*np.pi*(sigma**2))*np.exp(-((x-mu)**2)/(2*(sigma**2)))

bimodal = lambda x, mu1, sigma1, mu2, sigma2: gaus(x, mu1, sigma1)+gaus(x, mu2, sigma2)
- snippet.python
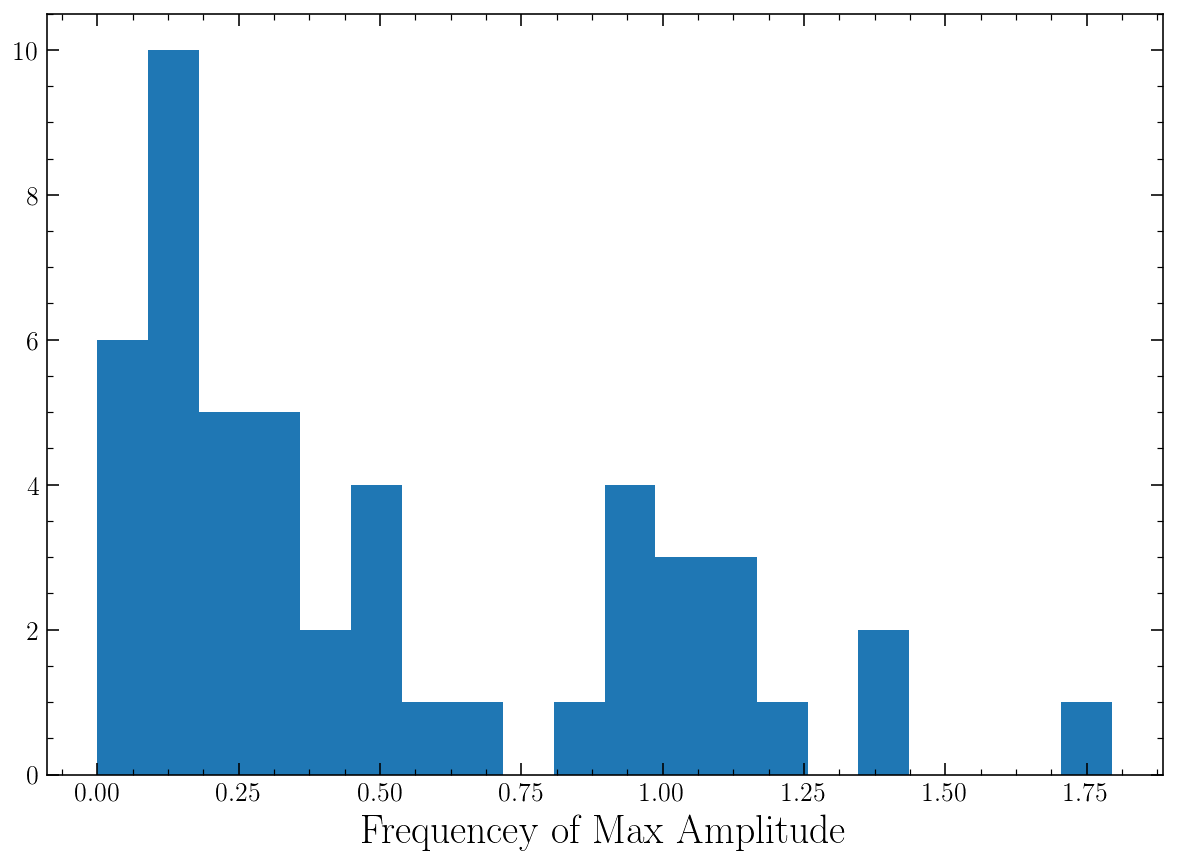
fig = plt.figure(figsize=(10, 7))
bins = plt.hist(stats[:, 0], bins=20)
centers = (bins[1][1:]+bins[1][:-1])/2
plt.xlabel('Frequencey of Max Amplitude', fontsize=20)
Text(0.5, 0, 'Frequencey of Max Amplitude')
- snippet.python
fit1, covar1 = curve_fit(gaus, centers, bins[0], p0=[0.1, 0.2])
err1 = np.sqrt(np.diag(covar1))
fit2, covar2 = curve_fit(gaus, centers, bins[0], p0=[1, 0.1])
err2 = np.sqrt(np.diag(covar2))
- snippet.python
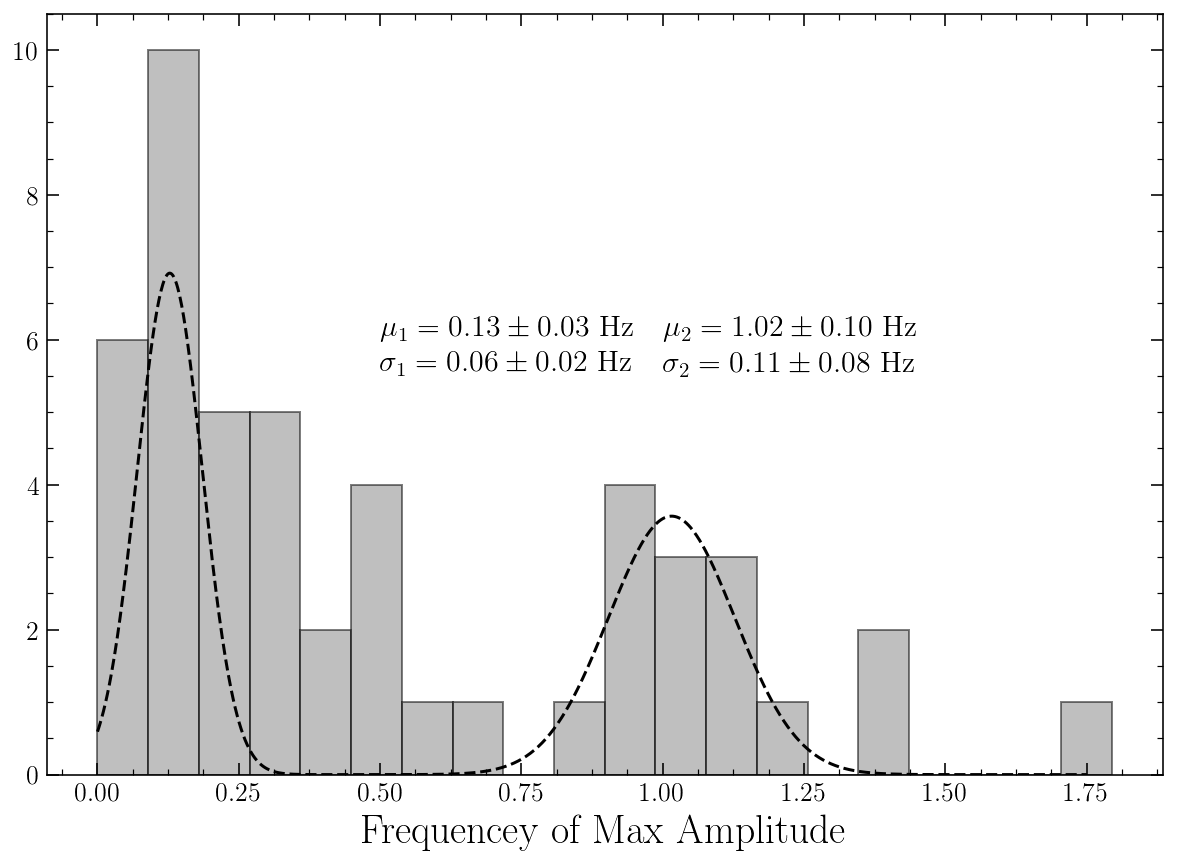
fig = plt.figure(figsize=(10, 7))
x = np.linspace(0, 1.75, 1000)
bins = plt.hist(stats[:, 0], bins=20, color='grey', alpha=0.5, ec='black')
plt.plot(x, gaus(x, *fit1)+gaus(x, *fit2), color='black', linestyle='dashed')
plt.xlabel('Frequencey of Max Amplitude', fontsize=20)

plt.annotate(r'$\mu_{{1}}={:0.2f}\pm{:0.2f}$ Hz'.format(fit1[0], err1[0]), xy=(0.5, 6), fontsize=15)
plt.annotate(r'$\sigma_{{1}}={:0.2f}\pm{:0.2f}$ Hz'.format(fit1[1], err1[1]), xy=(0.5, 5.5), fontsize=15)

plt.annotate(r'$\mu_{{2}}={:0.2f}\pm{:0.2f}$ Hz'.format(fit2[0], err2[0]), xy=(1, 6), fontsize=15)
plt.annotate(r'$\sigma_{{2}}={:0.2f}\pm{:0.2f}$ Hz'.format(fit2[1], err2[1]), xy=(1, 5.5), fontsize=15)

plt.savefig('Figures/FrequencyDist.pdf', bbox_inches='tight')
Velocity Analysis
- snippet.python
nonStatGaus = lambda x, mu, sigma, A: A*np.exp(-((x-mu)**2)/(2*(sigma**2)))
- snippet.python
meanVels = [np.std(x[1]) for x in velocities]
- snippet.python
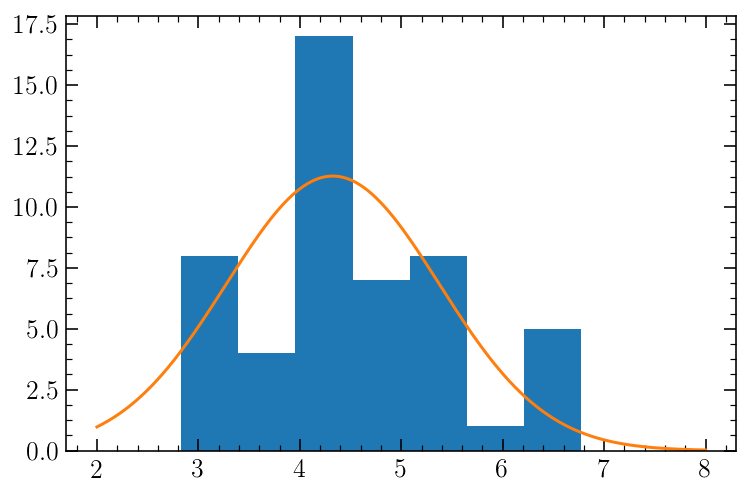
x = np.linspace(2, 8, 1000)
bins = plt.hist(meanVels, bins=7)
centers = (bins[1][1:]+bins[1][:-1])/2
fit, covar = curve_fit(nonStatGaus, centers, bins[0], p0=[4.5, 6, 7])
plt.plot(x, nonStatGaus(x, *fit))
plt.show()
- snippet.python
timeSeriseStats = np.zeros(shape=(49, 4))
count = 0
for did, dance in enumerate(velocities):
    if did != 9:
        timeSeriseStats[count, 0] = np.mean(dance[1])
        timeSeriseStats[count, 1] = np.median(dance[1])
        timeSeriseStats[count, 2] = np.max(dance[1])
        timeSeriseStats[count, 3] = np.std(dance[1])
        count += 1
- snippet.python
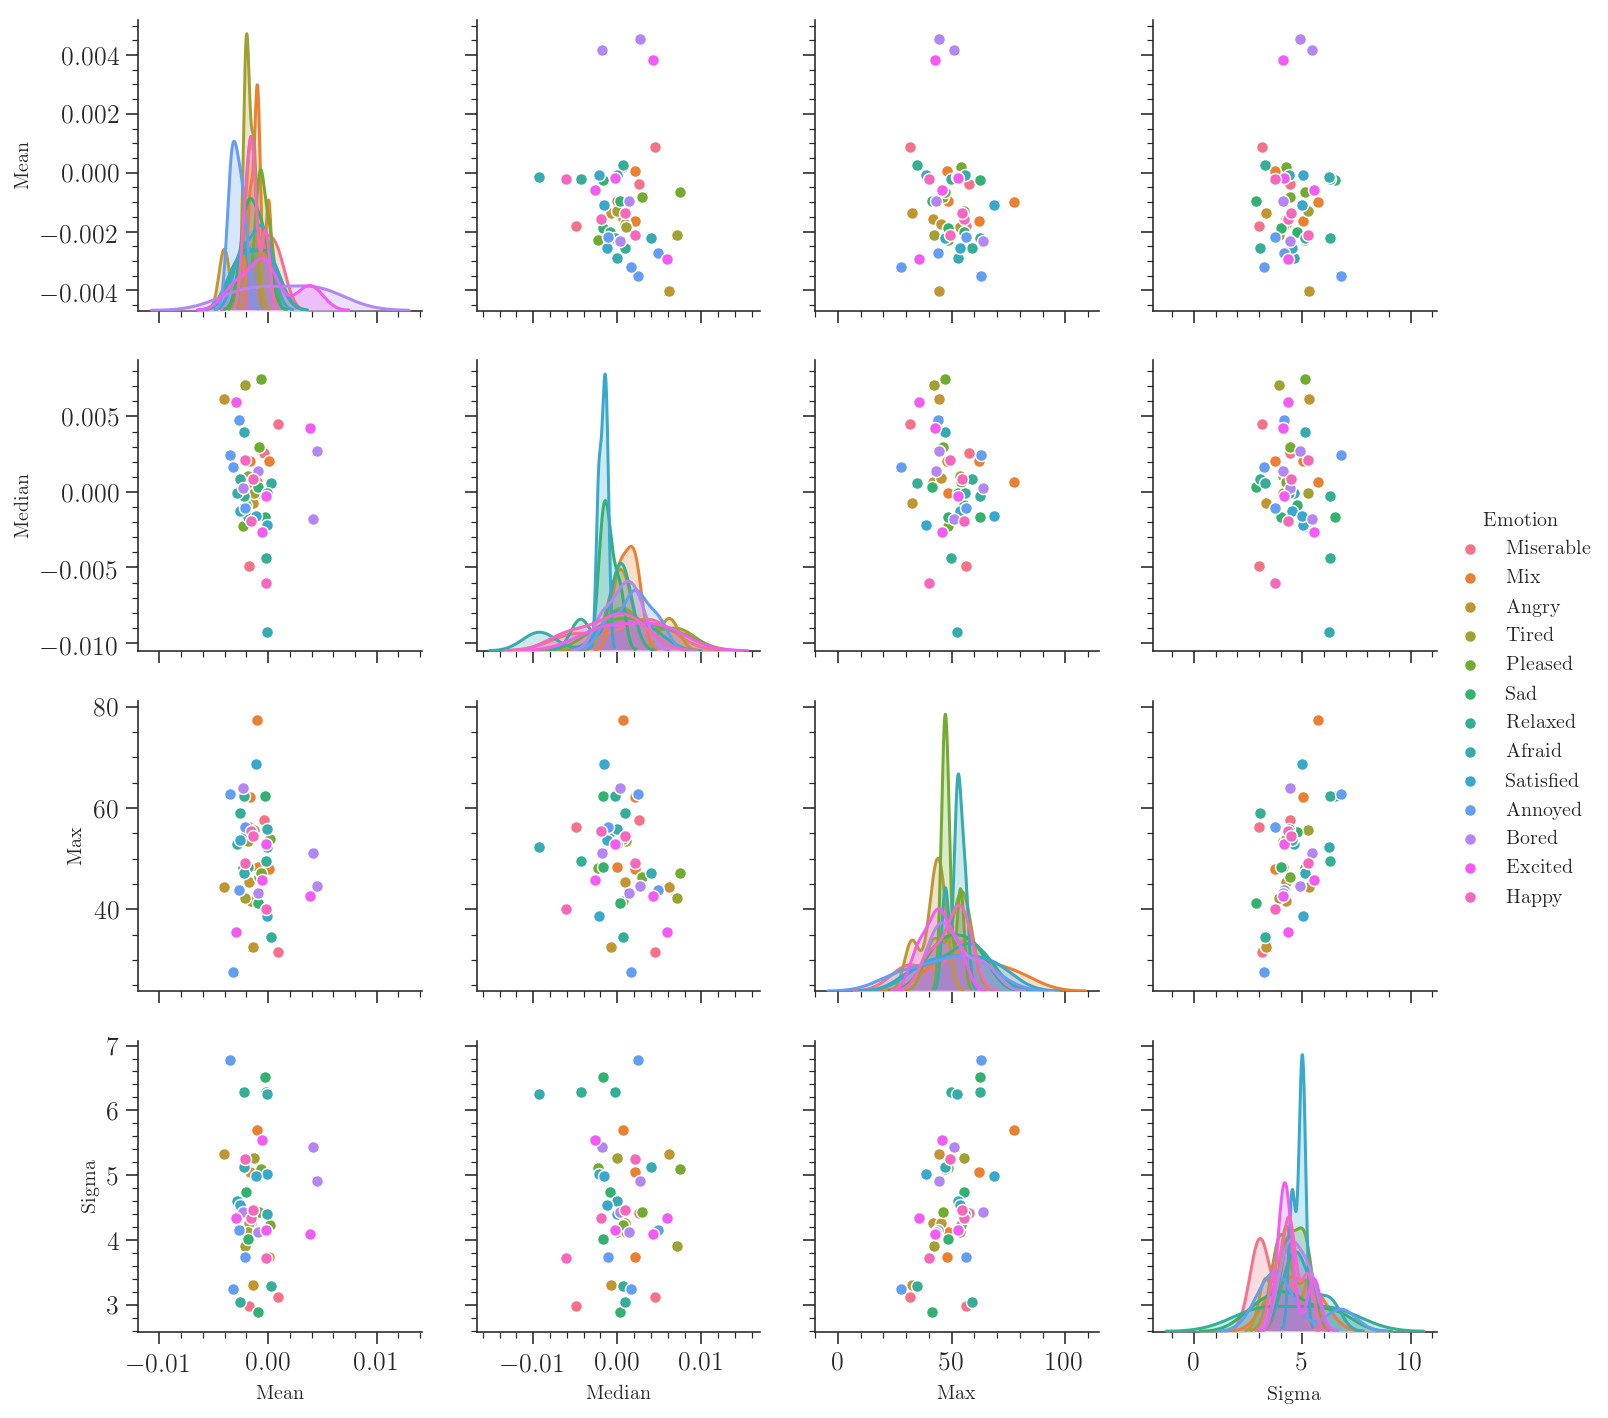
df = pd.DataFrame(data=timeSeriseStats, columns=['Mean', 'Median', 'Max', 'Sigma'])
df['Emotion'] = pd.Series(evalEmotions, index=df.index)
<div> <style scoped>
  .dataframe tbody tr th:only-of-type {
      vertical-align: middle;
  }
  .dataframe tbody tr th {
      vertical-align: top;
  }
  .dataframe thead th {
      text-align: right;
  }
</style> <table border=“1” class=“dataframe”
>
<thead>
  <tr style="text-align: right;">
    <th></th>
    <th>Mean</th>
    <th>Median</th>
    <th>Max</th>
    <th>Sigma</th>
    <th>Emotion</th>
  </tr>
</thead>
<tbody>
  <tr>
    <th>0</th>
    <td>-0.001798</td>
    <td>-0.004902</td>
    <td>56.168820</td>
    <td>2.978317</td>
    <td>Miserable</td>
  </tr>
  <tr>
    <th>1</th>
    <td>-0.001649</td>
    <td>0.002063</td>
    <td>62.108348</td>
    <td>5.054398</td>
    <td>Mix</td>
  </tr>
  <tr>
    <th>2</th>
    <td>-0.004032</td>
    <td>0.006175</td>
    <td>44.446849</td>
    <td>5.329097</td>
    <td>Angry</td>
  </tr>
  <tr>
    <th>3</th>
    <td>-0.002111</td>
    <td>0.007060</td>
    <td>42.284433</td>
    <td>3.910049</td>
    <td>Tired</td>
  </tr>
  <tr>
    <th>4</th>
    <td>-0.000834</td>
    <td>0.002970</td>
    <td>46.395794</td>
    <td>4.436914</td>
    <td>Pleased</td>
  </tr>
  <tr>
    <th>5</th>
    <td>-0.001896</td>
    <td>-0.001654</td>
    <td>48.362561</td>
    <td>4.013522</td>
    <td>Sad</td>
  </tr>
  <tr>
    <th>6</th>
    <td>-0.002551</td>
    <td>0.000869</td>
    <td>59.083402</td>
    <td>3.036652</td>
    <td>Relaxed</td>
  </tr>
  <tr>
    <th>7</th>
    <td>-0.002301</td>
    <td>-0.002254</td>
    <td>48.161705</td>
    <td>5.110528</td>
    <td>Pleased</td>
  </tr>
  <tr>
    <th>8</th>
    <td>-0.002890</td>
    <td>-0.000064</td>
    <td>52.981581</td>
    <td>4.607283</td>
    <td>Afraid</td>
  </tr>
  <tr>
    <th>9</th>
    <td>0.000044</td>
    <td>0.002082</td>
    <td>48.025167</td>
    <td>3.730987</td>
    <td>Mix</td>
  </tr>
  <tr>
    <th>10</th>
    <td>-0.000073</td>
    <td>-0.000042</td>
    <td>55.873222</td>
    <td>4.402845</td>
    <td>Afraid</td>
  </tr>
  <tr>
    <th>11</th>
    <td>-0.000254</td>
    <td>-0.001653</td>
    <td>62.410698</td>
    <td>6.520325</td>
    <td>Sad</td>
  </tr>
  <tr>
    <th>12</th>
    <td>-0.001560</td>
    <td>0.000646</td>
    <td>41.603721</td>
    <td>4.267015</td>
    <td>Angry</td>
  </tr>
  <tr>
    <th>13</th>
    <td>-0.001363</td>
    <td>-0.000718</td>
    <td>32.500379</td>
    <td>3.303371</td>
    <td>Angry</td>
  </tr>
  <tr>
    <th>14</th>
    <td>-0.002550</td>
    <td>-0.001232</td>
    <td>53.745451</td>
    <td>4.533554</td>
    <td>Satisfied</td>
  </tr>
  <tr>
    <th>15</th>
    <td>-0.001855</td>
    <td>0.001056</td>
    <td>53.571594</td>
    <td>4.125465</td>
    <td>Tired</td>
  </tr>
  <tr>
    <th>16</th>
    <td>-0.002170</td>
    <td>-0.001059</td>
    <td>56.175345</td>
    <td>3.739604</td>
    <td>Annoyed</td>
  </tr>
  <tr>
    <th>17</th>
    <td>-0.000951</td>
    <td>0.001410</td>
    <td>43.203369</td>
    <td>4.116629</td>
    <td>Bored</td>
  </tr>
  <tr>
    <th>18</th>
    <td>0.000185</td>
    <td>0.000682</td>
    <td>53.907577</td>
    <td>4.237050</td>
    <td>Pleased</td>
  </tr>
  <tr>
    <th>19</th>
    <td>-0.000184</td>
    <td>-0.000246</td>
    <td>52.905508</td>
    <td>4.148395</td>
    <td>Excited</td>
  </tr>
  <tr>
    <th>20</th>
    <td>-0.001560</td>
    <td>-0.001905</td>
    <td>55.523178</td>
    <td>4.340211</td>
    <td>Happy</td>
  </tr>
  <tr>
    <th>21</th>
    <td>-0.001759</td>
    <td>0.000900</td>
    <td>45.436848</td>
    <td>4.257791</td>
    <td>Angry</td>
  </tr>
  <tr>
    <th>22</th>
    <td>-0.000372</td>
    <td>0.002558</td>
    <td>57.722183</td>
    <td>4.424116</td>
    <td>Miserable</td>
  </tr>
  <tr>
    <th>23</th>
    <td>0.000884</td>
    <td>0.004534</td>
    <td>31.542905</td>
    <td>3.119212</td>
    <td>Miserable</td>
  </tr>
  <tr>
    <th>24</th>
    <td>-0.002209</td>
    <td>-0.000254</td>
    <td>62.365436</td>
    <td>6.278034</td>
    <td>Relaxed</td>
  </tr>
  <tr>
    <th>25</th>
    <td>-0.003495</td>
    <td>0.002474</td>
    <td>62.691057</td>
    <td>6.775984</td>
    <td>Annoyed</td>
  </tr>
  <tr>
    <th>26</th>
    <td>-0.000142</td>
    <td>-0.009252</td>
    <td>52.386723</td>
    <td>6.254499</td>
    <td>Afraid</td>
  </tr>
  <tr>
    <th>27</th>
    <td>-0.000601</td>
    <td>-0.002673</td>
    <td>45.750873</td>
    <td>5.537992</td>
    <td>Excited</td>
  </tr>
  <tr>
    <th>28</th>
    <td>-0.002934</td>
    <td>0.005929</td>
    <td>35.486262</td>
    <td>4.347244</td>
    <td>Excited</td>
  </tr>
  <tr>
    <th>29</th>
    <td>-0.002131</td>
    <td>0.002095</td>
    <td>49.055195</td>
    <td>5.256263</td>
    <td>Happy</td>
  </tr>
  <tr>
    <th>30</th>
    <td>0.004173</td>
    <td>-0.001804</td>
    <td>51.143077</td>
    <td>5.439556</td>
    <td>Bored</td>
  </tr>
  <tr>
    <th>31</th>
    <td>-0.000224</td>
    <td>-0.006051</td>
    <td>40.074855</td>
    <td>3.727305</td>
    <td>Happy</td>
  </tr>
  <tr>
    <th>32</th>
    <td>-0.002232</td>
    <td>0.004002</td>
    <td>47.220204</td>
    <td>5.129865</td>
    <td>Afraid</td>
  </tr>
  <tr>
    <th>33</th>
    <td>-0.003202</td>
    <td>0.001654</td>
    <td>27.594398</td>
    <td>3.238834</td>
    <td>Annoyed</td>
  </tr>
  <tr>
    <th>34</th>
    <td>-0.002317</td>
    <td>0.000272</td>
    <td>63.977990</td>
    <td>4.435240</td>
    <td>Bored</td>
  </tr>
  <tr>
    <th>35</th>
    <td>-0.002719</td>
    <td>0.004786</td>
    <td>43.860434</td>
    <td>4.161989</td>
    <td>Annoyed</td>
  </tr>
  <tr>
    <th>36</th>
    <td>-0.000957</td>
    <td>0.000309</td>
    <td>41.176874</td>
    <td>2.883719</td>
    <td>Sad</td>
  </tr>
  <tr>
    <th>37</th>
    <td>-0.001290</td>
    <td>-0.000089</td>
    <td>55.583615</td>
    <td>5.272462</td>
    <td>Tired</td>
  </tr>
  <tr>
    <th>38</th>
    <td>-0.000217</td>
    <td>-0.004358</td>
    <td>49.607502</td>
    <td>6.279034</td>
    <td>Relaxed</td>
  </tr>
  <tr>
    <th>39</th>
    <td>-0.000071</td>
    <td>-0.002206</td>
    <td>38.600903</td>
    <td>5.021533</td>
    <td>Satisfied</td>
  </tr>
  <tr>
    <th>40</th>
    <td>-0.001090</td>
    <td>-0.001596</td>
    <td>68.660583</td>
    <td>4.984018</td>
    <td>Satisfied</td>
  </tr>
  <tr>
    <th>41</th>
    <td>-0.000999</td>
    <td>0.000668</td>
    <td>77.463016</td>
    <td>5.703841</td>
    <td>Mix</td>
  </tr>
  <tr>
    <th>42</th>
    <td>-0.001357</td>
    <td>0.000859</td>
    <td>54.578165</td>
    <td>4.464673</td>
    <td>Happy</td>
  </tr>
  <tr>
    <th>43</th>
    <td>0.003839</td>
    <td>0.004214</td>
    <td>42.680804</td>
    <td>4.096789</td>
    <td>Excited</td>
  </tr>
  <tr>
    <th>44</th>
    <td>-0.002007</td>
    <td>-0.000875</td>
    <td>55.284132</td>
    <td>4.743275</td>
    <td>Sad</td>
  </tr>
  <tr>
    <th>45</th>
    <td>0.004543</td>
    <td>0.002699</td>
    <td>44.558832</td>
    <td>4.904963</td>
    <td>Bored</td>
  </tr>
  <tr>
    <th>46</th>
    <td>0.000246</td>
    <td>0.000620</td>
    <td>34.547461</td>
    <td>3.294687</td>
    <td>Relaxed</td>
  </tr>
  <tr>
    <th>47</th>
    <td>-0.000669</td>
    <td>0.007457</td>
    <td>47.166044</td>
    <td>5.101586</td>
    <td>Pleased</td>
  </tr>
  <tr>
    <th>48</th>
    <td>-0.000959</td>
    <td>-0.000093</td>
    <td>48.413527</td>
    <td>4.118721</td>
    <td>Mix</td>
  </tr>
</tbody>
</table>
<
/div>
- snippet.python
with sns.axes_style("ticks"):
    sns.pairplot(df, hue='Emotion')

plt.savefig('Figures/PairPlot.pdf', bbox_inches='tight')
/home/tboudreaux/anaconda3/envs/general/lib/python3.7/site-packages/scipy/stats/stats.py:1713: FutureWarning: Using a non-tuple sequence for multidimensional indexing is deprecated; use `arr[tuple(seq)]` instead of `arr[seq]`. In the future this will be interpreted as an array index, `arr[np.array(seq)]`, which will result either in an error or a different result.
  return np.add.reduce(sorted[indexer] * weights, axis=axis) / sumval
Periodic Behavior in Velocity
- snippet.python
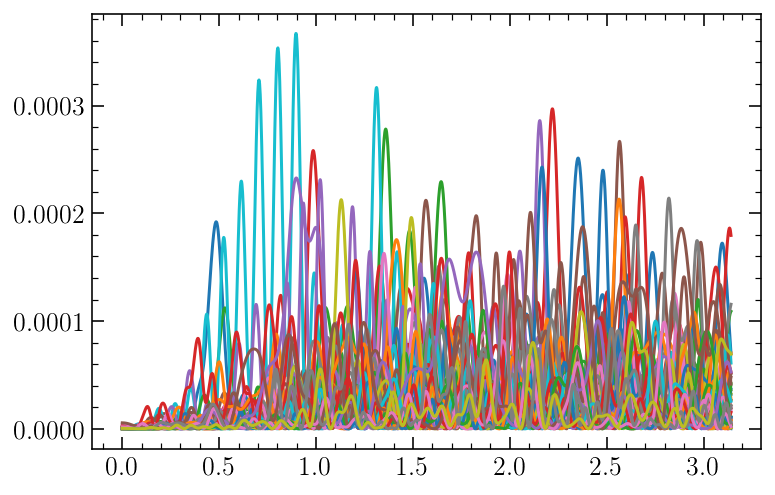
FTs_V = np.zeros(shape=(49, 2, 2000))
- snippet.python
count = 0
for did, dance in tqdm(enumerate(velocities), total=len(velocities)):
    if did != 9:
        f, pgram = genLSP(dance[0], dance[1], s=2000)
        FTs_V[count, 0] = f
        FTs_V[count, 1] = pgram
        count += 1
- snippet.python
for fid, FT in enumerate(FTs_V):
    plt.plot(FT[0], FT[1])
- snippet.python
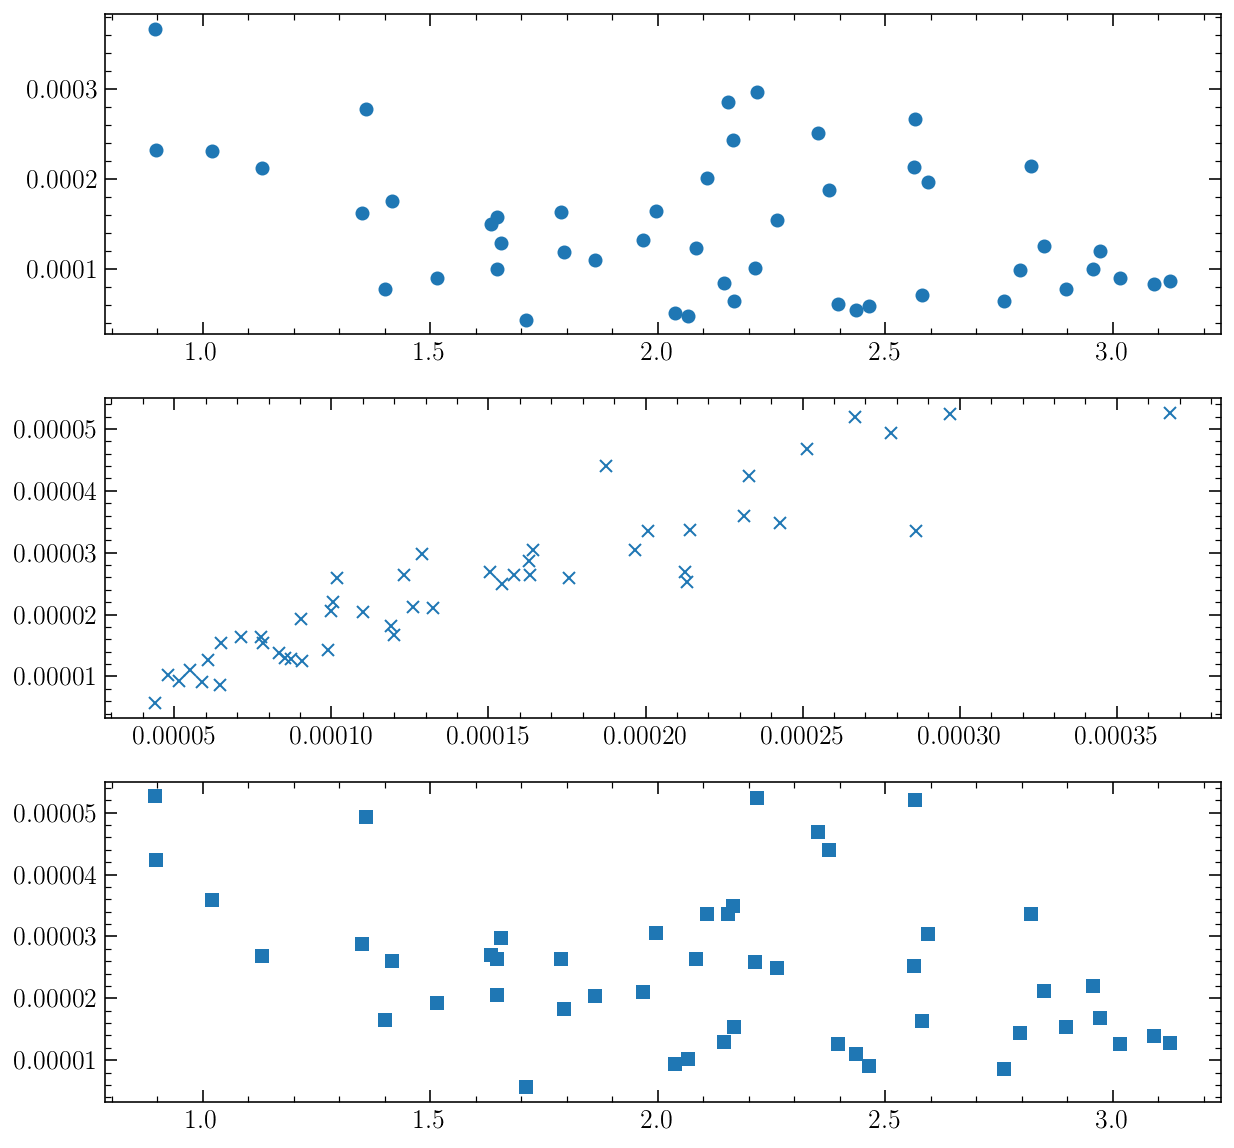
stats_V = np.zeros(shape=(49, 3))
count = 0
for fid, FT in enumerate(FTs_V):
    stats_V[count] = np.array([FT[0][FT[1].argmax()], FT[1][FT[1].argmax()], np.mean(FT[1])])
    count += 1
- snippet.python
fig, axs = plt.subplots(3, 1, figsize=(10, 10))
axs[0].plot(stats_V[:, 0], stats_V[:, 1], 'o')
axs[1].plot(stats_V[:, 1], stats_V[:, 2], 'x')
axs[2].plot(stats_V[:, 0], stats_V[:, 2], 's')
[<matplotlib.lines.Line2D at 0x7fed82866c88>]
- snippet.python
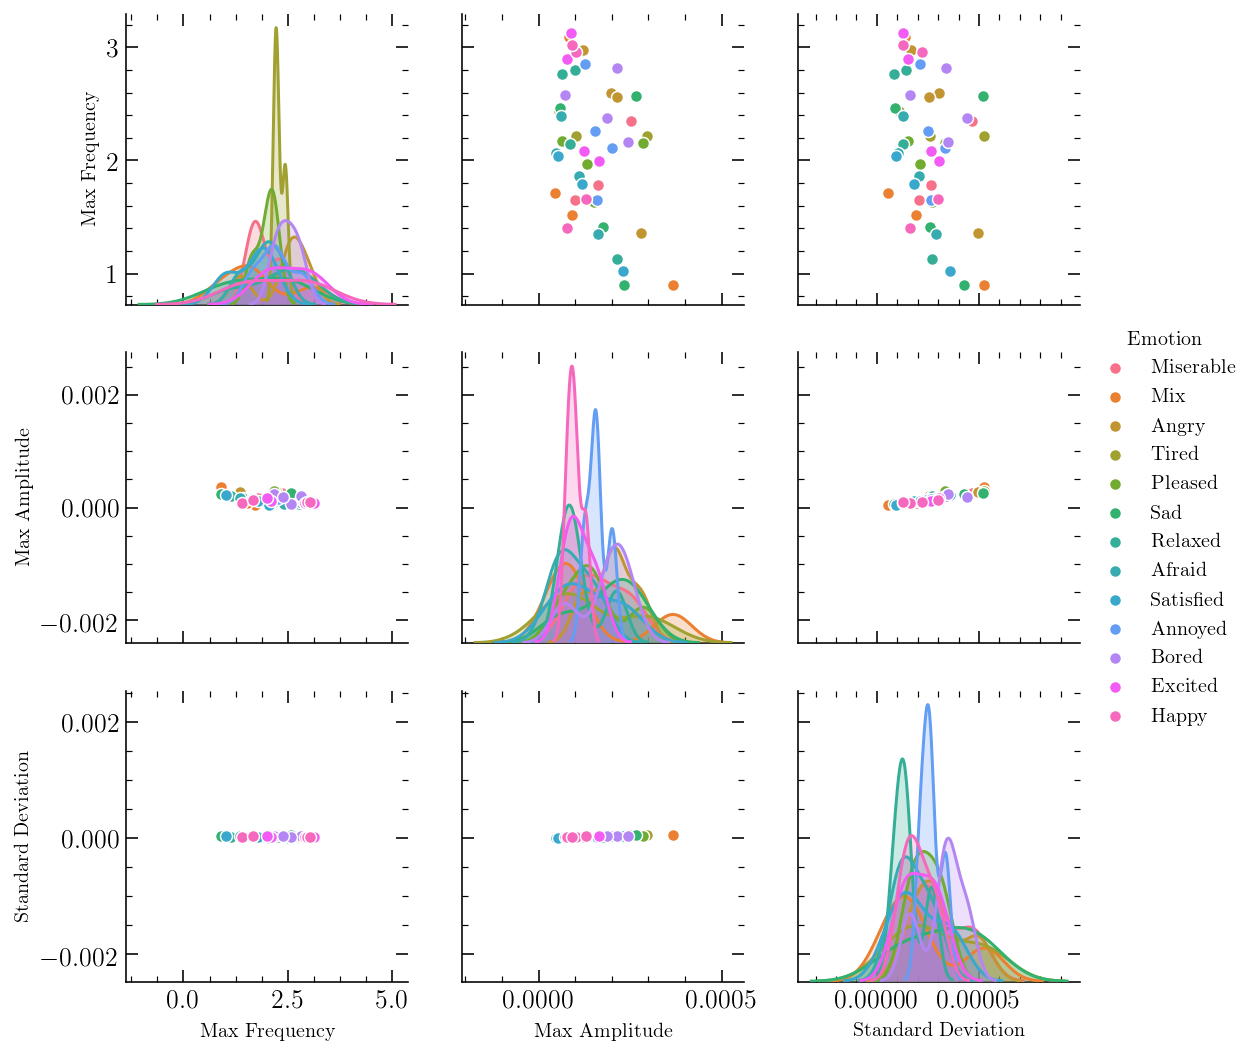
df = pd.DataFrame(data=stats_V, columns=['Max Frequency', 'Max Amplitude', 'Standard Deviation'])
df['Emotion'] = pd.Series(evalEmotions, index=df.index)
- snippet.python
sns.pairplot(df, hue="Emotion")
/home/tboudreaux/anaconda3/envs/general/lib/python3.7/site-packages/scipy/stats/stats.py:1713: FutureWarning: Using a non-tuple sequence for multidimensional indexing is deprecated; use `arr[tuple(seq)]` instead of `arr[seq]`. In the future this will be interpreted as an array index, `arr[np.array(seq)]`, which will result either in an error or a different result.
  return np.add.reduce(sorted[indexer] * weights, axis=axis) / sumval


<seaborn.axisgrid.PairGrid at 0x7fed80383ba8>
python
